HouseZero® Real-time Performance Data
HouseZero® (HZ), which serves as the headquarters for the Harvard Center for Green Buildings and Cities (CGBC), also functions as a living laboratory. HouseZero is continuously collecting data to inform necessary improvements, to enhance our understanding of building performance, and to conduct experimentation. This page provides real-time energy, indoor temperature, and carbon-performance data for HouseZero. Microclimatic data of temperature, solar radiation, wind speed, and wind direction are also provided. This information is provided as part of the CGBC educational mission: to promote heightened understanding of building performance through data and building science.
Microclimatic Weather Data
Every building is subject to varying weather conditions that influence its performance. Microclimatic conditions of temperature, solar radiation (total horizontal radiation W/m2), wind speed, and wind direction from the onsite HZ weather station are displayed. These two weather data points are presented in three formats: Instantaneous, Weekly, and Monthly. Each format corresponds to the energy data displayed.
Instantaneous Data
HouseZero real-time view
C Temperature
W/m2 Solar Radiation
m/s Wind Speed
Wind Direction
Weekly Data
Average Outdoor Temperature
Total Solar Radiation
Monthly Data
Average Outdoor Temperature
Total Solar Radiation
Energy Data and Indoor Temperature Performance
The energy data shows building energy use, photovoltaic (PV) production, and the net value (PV production – Energy Use). A positive net value indicates more energy being produced than used during the period. These three key data points are displayed in four figures:
- Instantaneous Data, for all loads in the building and PV (in real-time).
- Weekly Data, for all loads in the building and PV, updated weekly.
- Monthly Data Comprehensive, for all loads in the building and PV, updated monthly.
- Monthly Data Comprehensive, excluding Plugs & IT, for all the for all loads in the building excluding plug loads and IT loads (servers), updated monthly.
Interior building temperature is also displayed in hourly-average format (hourly indoor average temperature), showing the last 24 hours and updated hourly. In addition, it is displayed in daily average format (daily indoor average temperature), updated daily and showing the last 30 days.
Detailed information regarding HZ data can be found in the peer-reviewed papers:
"Comprehensive Assessment of Operational Performance of Coupled Natural Ventilation and Thermally Active Building Systems via an Extensive Sensor Network”
and
“Data-Informed Building Energy Management (DiBEM) towards Ultra-Low Energy Buildings: The Case of HouseZero.”
View summaries of the first and second-year data.
Instantaneous Data
kW PV Production
kWh Total Energy Use
kW Net
Weekly Data
Monthly Data-Comprehensive
Monthly Data-Comprehensive, excluding Plugs & IT
Hourly Indoor Average Temperature
Daily Indoor Average Temperature
Carbon Data
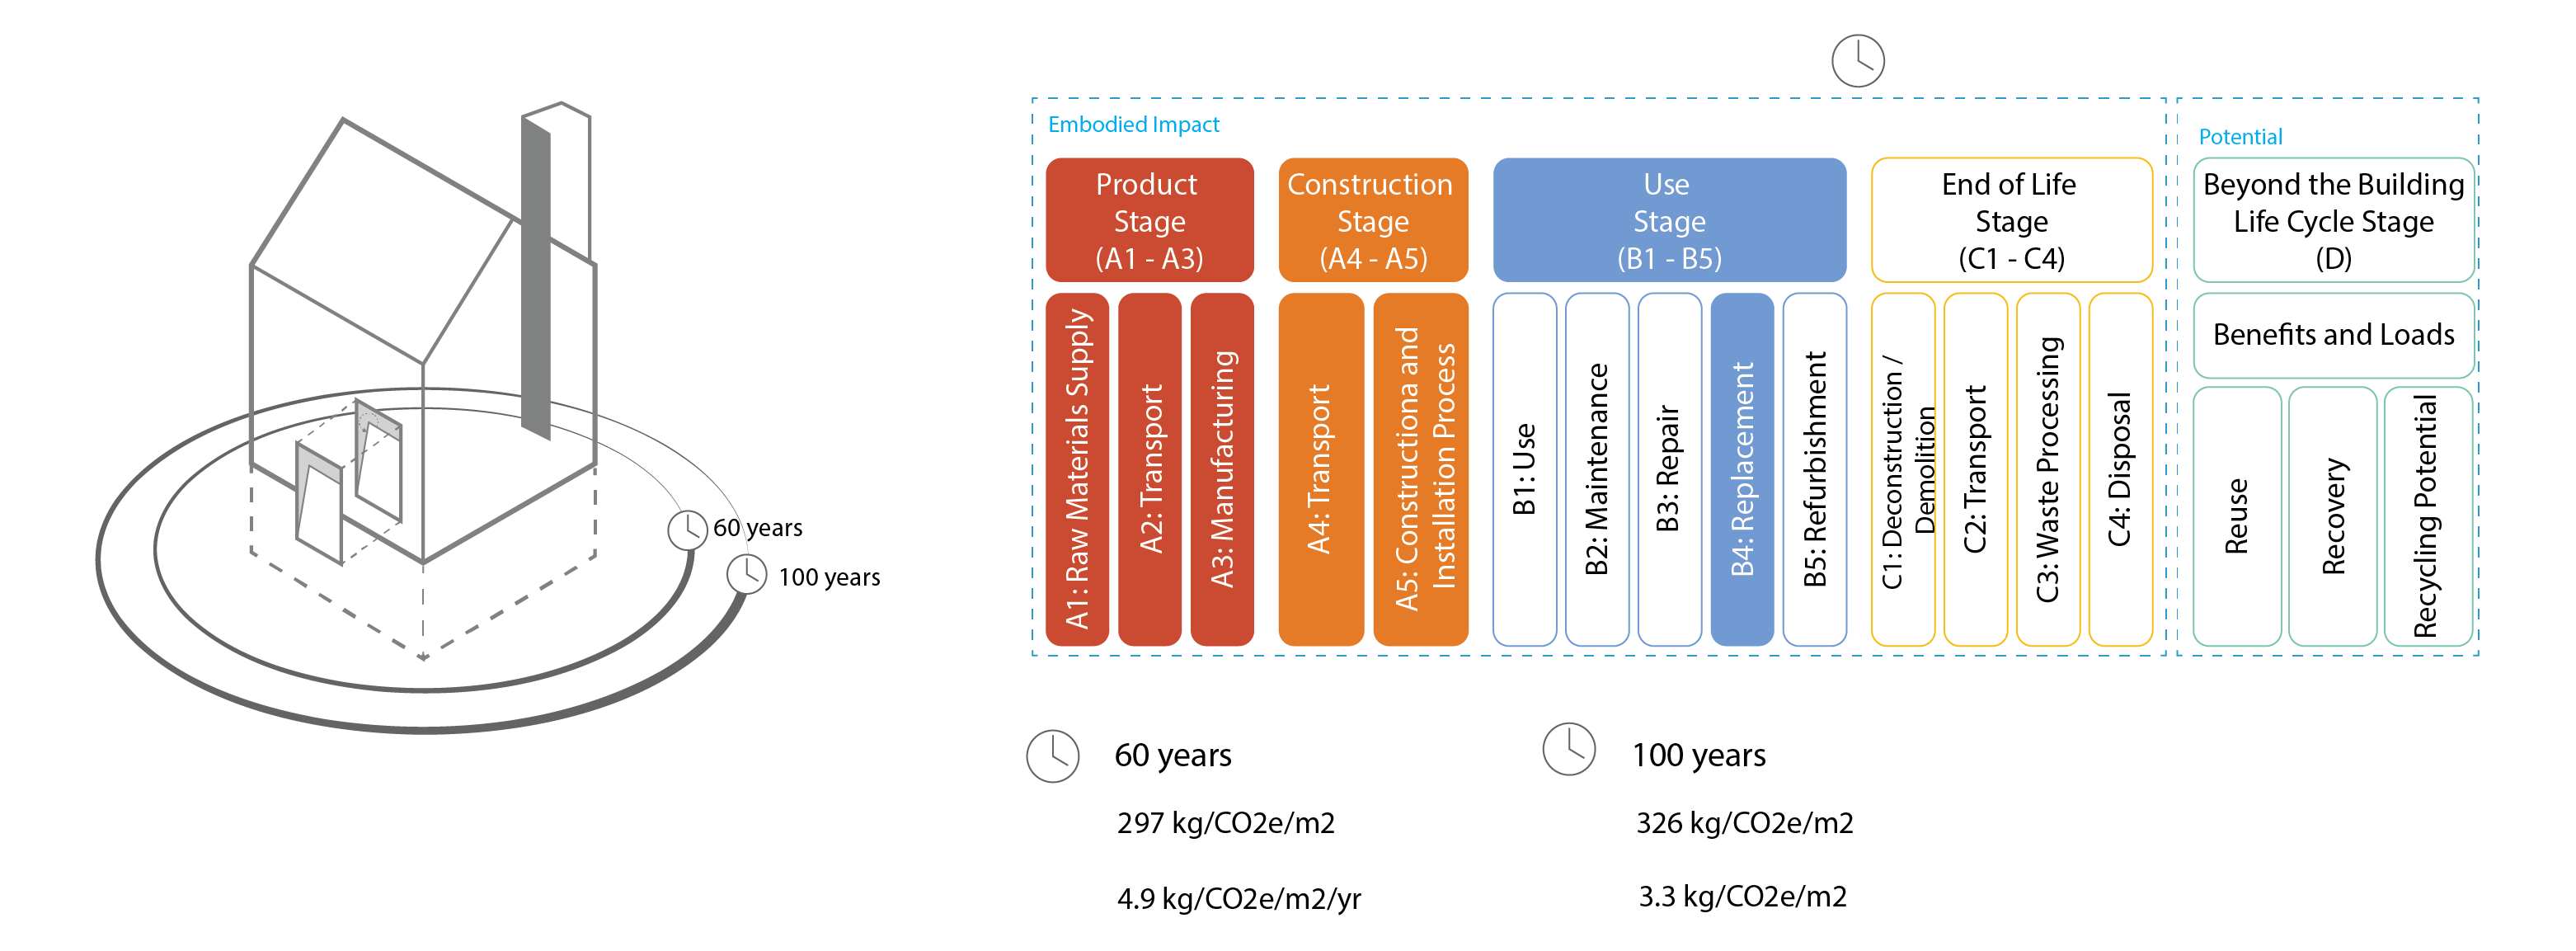
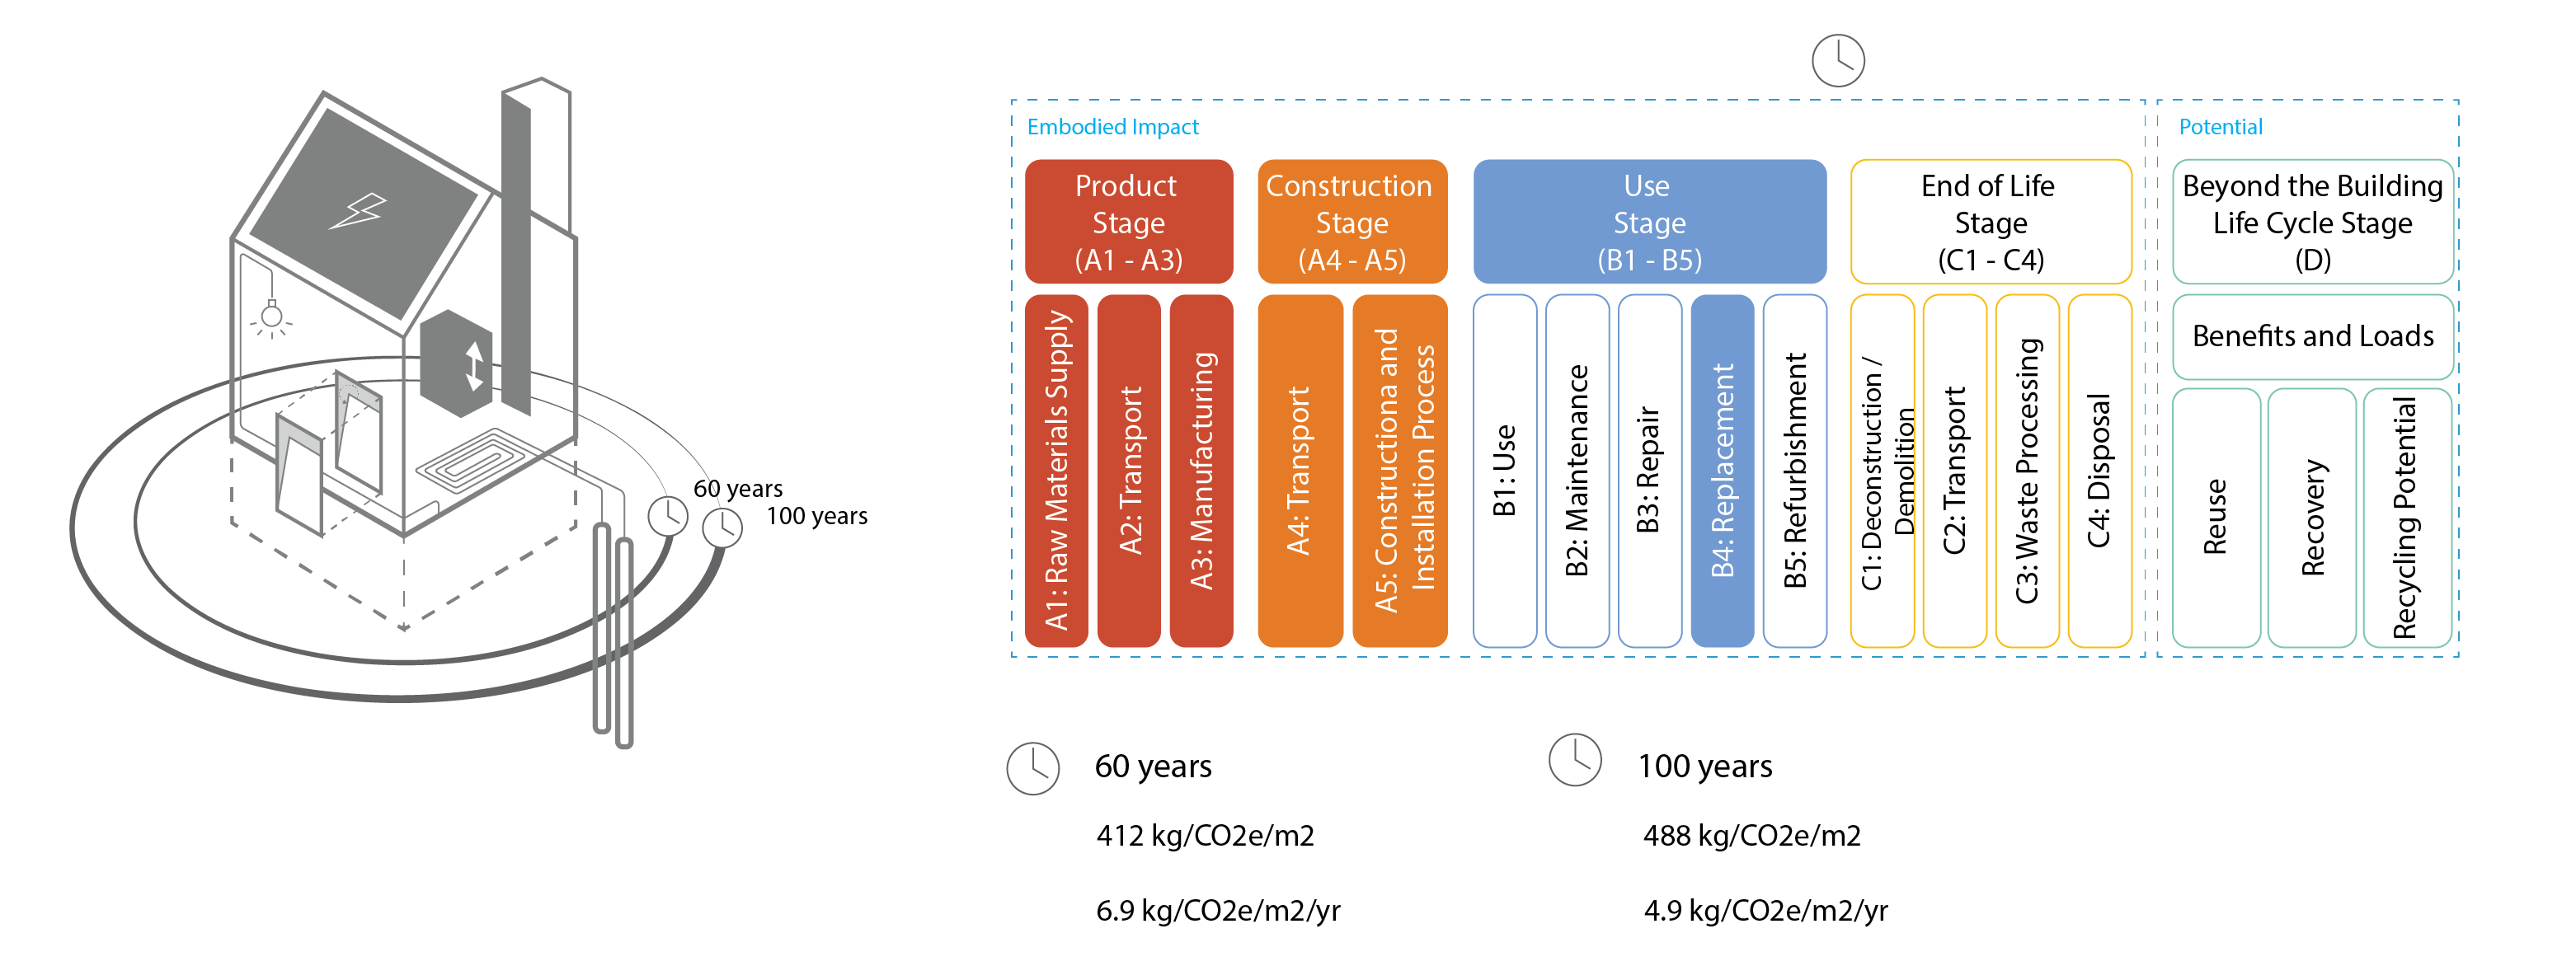
HouseZero has relatively low embodied carbon for a building of its type. This was carefully planned given its constraints (operating as an office space and experimental laboratory) and aims to maintain the lowest possible operational energy. Detailed information regarding its embodied carbon is fully described in the peer-reviewed journal paper Zero-carbon balance: The case of HouseZero, which includes the full lifecycle assessment (LCA) data. This paper includes both HouseZero’s carbon balance over a 100-year estimated building life and the carbon balance for a 60-year estimated building life. The paper provides a transparent and complete LCA, including all systems and stages, to support external use of the Center’s data, to help inform future benchmarking models, and to derive methods for estimating complete LCA data based on a limited LCA study. Read a summary of the paper.
When temporal and physical system boundaries are aligned to current benchmarking studies, the normalized embodied CO2e emissions of HouseZero is 233 kg CO2e/ m2 (initial embodied CO2e in the product and construction phases without technical systems).

Adding the technical systems in HouseZero, the total initial embodied CO2e in the product and construction phase including all technical systems (as detailed in the paper) is 295 CO2e/m2.

For the 100-year estimated building life of HouseZero, the embodied carbon emissions per square meter of occupied space of HouseZero is 326 kg CO2e/m2. When calculated for 60 years, the total is 297 kg/Co2e/m2. These calculations include carbon emissions generated from the extraction, manufacturing, construction, and replacement of all elements considered to be within the building’s physical system boundary. It incorporates the building’s material systems (e.g., building assemblies including the foundation, structure, enclosure, and interior partitions and finishes) without technical systems.


Four different grid emissions methodologies are analyzed to illustrate the calculation’s impact on HouseZero’s carbon balance estimates. The aim is to highlight the importance of additional research into real-time emissions estimation at the building level.
The graphs below show results from these analyses, including offset emissions for solar PV production, operational energy use, embodied carbon emissions, and resulting net carbon balance. They show the yearly data balance, based on 100 year LCA calculations. Positive net energy production results above equate to negative net carbon emissions (offset emissions) in the data below. Given the differences in methodologies and inputs, the magnitude of calculated emissions should not be compared between methods. Using existing standards, operational emissions are based on total load, without IT (e.g., data servers) and plug loads. We estimate embodied carbon emissions generated from the extraction, manufacturing, construction, and replacement of all elements considered to be within the building’s physical system boundary. These calculations include the building’s material systems (e.g., building assemblies including the foundation, structure, enclosure, and interior partitions and finishes) but exclude technical equipment that are not as typical in most studies.
Two time periods are depicted in the series of graphs below: left-panel graphs show the most recent year-to-date cumulative carbon, and right-panel graphs show the total cumulative carbon to date. Both year-to-date and cumulative estimates will be updated monthly.
Methodology 1: Annualized estimates based on 100-year Scenario
The first set of graphs below illustrate annualized emissions estimates based on the 100-year scenario that reflects the prediction of U.S. grid energy CO2e-intensity during the building’s design. The detailed information is described in our peer-reviewed publication “Zero-carbon balance: the case of HouseZero”.100-year Average
Total carbon for current year to date
Total yearly accumulative carbon to date
Methodology 2: Estimates based on annual average ISO-NE emissions factor
Estimates from the second analysis are based on the ISO-NE annual average emissions rate for native generation only, which is calculated by dividing the total generator emissions by the total generation from all units (Refer to section 3.2). All electric generators and demand response resources dispatched by ISO New England are included in the emissions calculations. Results from this analysis are shown below. In this analysis, the 2021 emissions factor is used as a proxy for more current years. Graphs will be updated once the final 2022/2023 emissions factors become available from ISO-NE.ISO-NE (Annual Average)
Total carbon for current year to date
Total yearly accumulative carbon to date
Methodology 3: Estimates based on ISO-NE daily real-time emissions factor
The third analysis incorporates the ISO-NE daily average real-time emissions factor, which is derived by dividing the estimated average carbon emissions from New England power plants by the actual daily real-time electricity usage on New England’s bulk power grid, without considering the imported electricity from neighboring areas. The estimates are for resources using oil, refuse, wood, coal, landfill gas, or natural gas to generate electricity. (https://www.iso-ne.com/isoexpress/).ISO-NE Real-Time (Daily Average)
Total carbon for current year to date
Total yearly accumulative carbon to date
Methodology 4: Estimates based on Harvard University annual average market-based emissions factor
The fourth analysis uses the Harvard University annual average market-based emissions factor and was performed in collaboration with Harvard’s Office for Sustainability, Environmental Health & Safety, and Energy & Facilities. This factor includes onsite electricity generation and purchased electricity from the grid. It is important to note that the estimates based on the Harvard emissions factor presented in the graphs below are not comparable to estimates based on the ISO-NE factor, due to differences in both methodologies and inputs. The graphs below use the draft 2020 Harvard emissions factor as a proxy for time periods 2021-2023. In general, the emissions factor does not change more than 5% per year, but purchased electric loads are incorporating more renewables each year. Graphs will be updated as more recent Harvard data become available.Harvard (Annual Average)
Total carbon for current year to date
Total yearly accumulative carbon to date